Editor's Comments.

I've been warning that Australian prices along with several major Western countries including my own Canada would see the real estate bubbles burst this year.
I started putting out the alarms early last year.
.%C2%A0.jpg)
At the time nobody believed.
Those that did believe me didn't care and now a lot of owners are stuck with rising interest rates and falling real estate prices.
I've been in real estate for 50 years during which I've seen many markets come and go.
In fact, the last 30 years I've been predicting markets worldwide with almost 100% accuracy.
So, I believe as this article states that home prices in Australia and many other countries such as Canada and United States could drop by 30% in the next 24 months.
Greener Pastures:
In the meantime, Bali has already had its crash with prices down 20 to 50% from 2014.
Several weeks ago, I put out a buy signal for Bali for the second time in my 23 years of living here.
I really went out on a limb and made a statement that saw no war on the East Coast will see the hottest real estate marketing in Indonesia or perhaps even in Asia due to a new medical tourism Centre universities and huge demand from baby boomers wishing to retire in the quieter safer and cleaner area of Bali.
More & more foreigners are discovering that Bali is one of the least expensive places to live in the world.
Better to do what and English couple did
yesterday get out of there United Kingdom home and getting into an apartment inBali for $98,000- or three-bedroom huge luxury villa for $248,000.
I can make that happen for you including help you get return visits etc. just call me direct on what's up at +628123814014.

Australian House Price Could Drop 30 %
House prices dropped across Australia in August but some capital cities fared better than others – one city was hit by a devastating drop.
September 2, 2022 - 5:41AM
Business columnist Terry McCrann says once the Reserve Bank started to “take away the cookie jar” of low interest rates, house prices were going to plateau and…
More from australian economy
Graph reveals ‘crazy’ rise in car prices
‘Returning the favour’: Albo’s baby savaged
New tax change could increase your rent
ANALYSIS
The latest dwelling value results are sobering reading for anybody who recently borrowed heavily to purchase a home.
Dwelling values nationally fell 1.6 per cent over the month – the fourth consecutive monthly decline. The losses were driven by Sydney (-2.3 per cent), Brisbane (-1.9 per cent) and Melbourne (-1.2 per cent), with Perth (-0.2 per cent) and Adelaide (-0.1 per cent) also finally joining the correction, data from CoreLogic shows.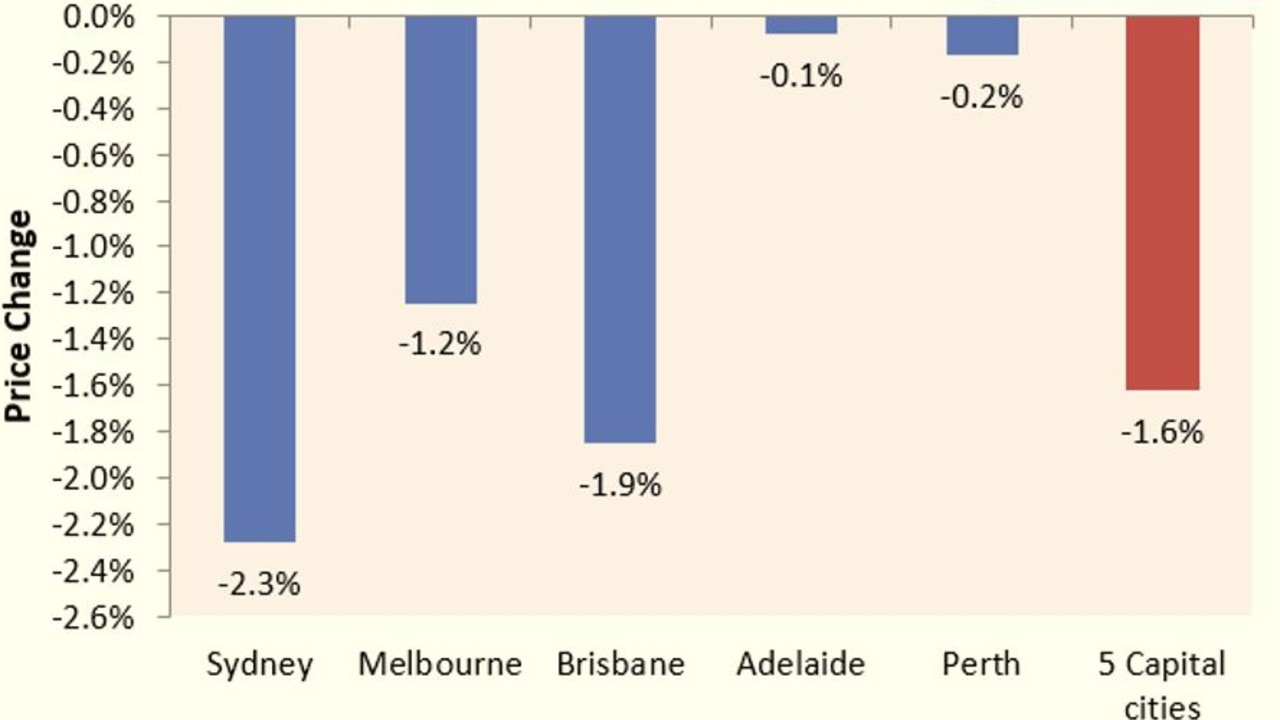
The quarterly rate of decline accelerated to 3.9 per cent at the five-city aggregate level, driven by heavy falls across Sydney (-5.9 per cent), Melbourne (-3.8 per cent), and Brisbane (-2.5 per cent).
By contrast Adelaide (1.6 per cent) and Perth (0.4 per cent) remained in positive territory; albeit with the pace of growth fading fast.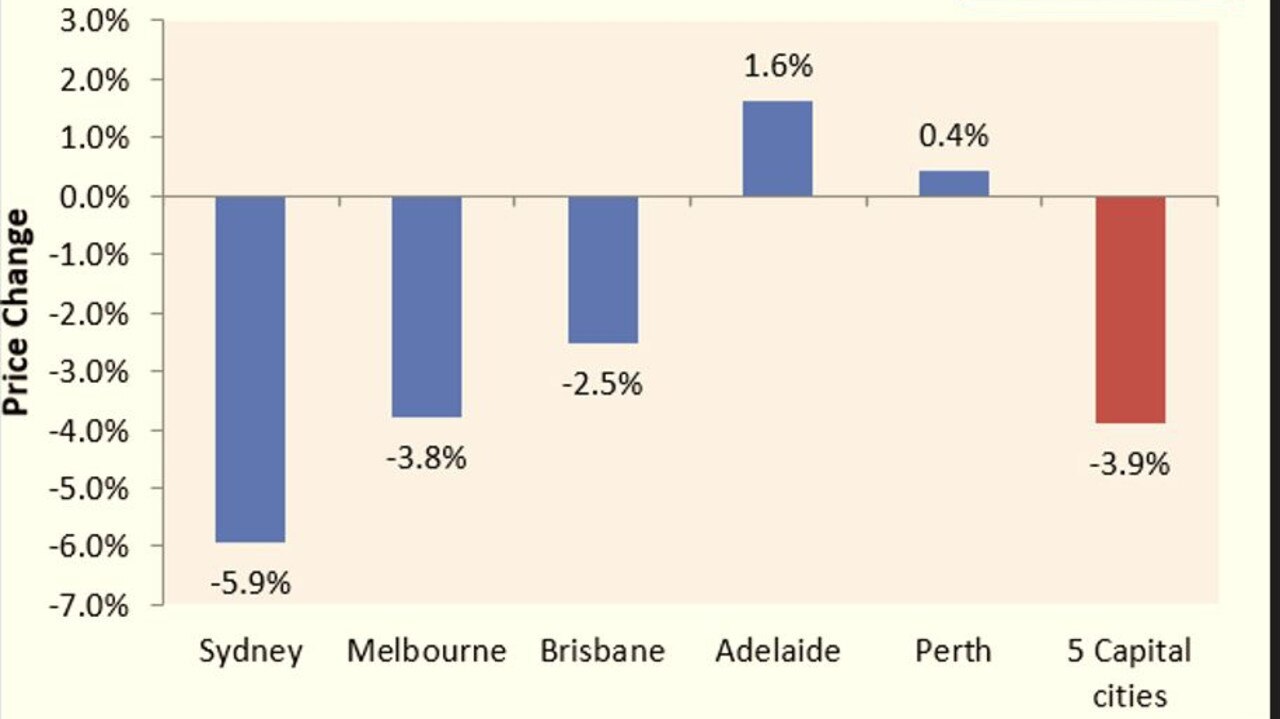
The quarterly decline in dwelling values is the steepest since 1983 at the five-city aggregate level and across Sydney, whereas Melbourne’s quarterly decline was its fastest since February 2019 and Brisbane’s since 2008.
Dwelling values are now tracking 4.2 per cent below their April peak at the five-city aggregate level, with Sydney down 7.4 per cent from peak, Melbourne down 4.6 per cent, and Brisbane down 2.7 per cent.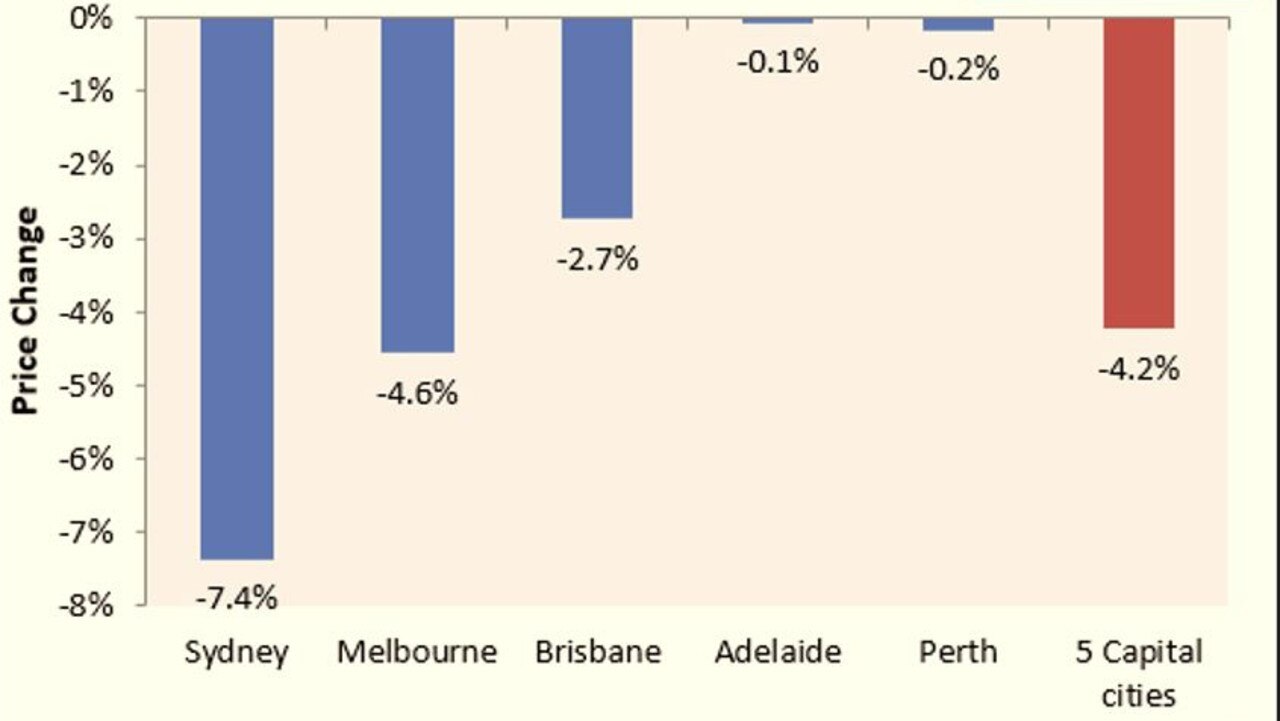
How Australia’s housing correction compares with history
The below charts plot the current dwelling corrections across Sydney, Melbourne and the five-city aggregate level (black lines) against prior episodes, using the CoreLogic monthly hedonic index.
Sydney’s current 7.4 per cent correction has a long way to go before it reaches the depths of the 1982-83 bust (-17.4 per cent over 11 months) or the 2017-19 correction (-14.9 per cent over 23 months). However, the pace of decline is the second fastest on record at this stage of the downturn (seven months in), with the pace of decline also accelerating sharply over the past quarter.
Melbourne’s current 4.6 per cent correction also has a long way to go before it catches the major busts recorded in 2017-19 (11.1 per cent over 19 months) and 1989-92 (9.8 per cent over 21 months). The current correction’s pace of decline six months in is also the fourth fastest on record. Finally, while the current correction of 4.2 per cent over four months at the five-city aggregate level is nothing special against the corrections of 2017-19 (10.7 per cent over 21 months) or 1982-83 (8.7 per cent over 10 months), it is the fastest decline at this stage of the cycle on record.
Australia faces its largest house price correction on record
Ultimately, how deep this housing correction goes will depend on how aggressively the Reserve Bank of Australia (RBA) hikes interest rates, given higher mortgage rates lower borrowing capacity and reduces housing demand.
Economists and the market universally anticipate that the RBA will lift the official cash rate (OCR) another 0.5 per cent next week to 2.35 per cent, marking the fifth consecutive rise.
From there, opinion is divided. CBA, AMP and NAB believe the OCR will peak at 2.6 per cent, whereas ANZ and Westpac forecast a 3.25 per cent peak in early 2023.
The bond market is even more hawkish, pricing a peak OCR of 3.80 per cent by mid-2023.
How high will mortgages go?
Under the lower CBA, AMP and NAB OCR forecast, Australia’s average discount variable mortgage rate would rise to 5.95 per cent, up from 3.45 per cent in April 2022 immediately before the RBA’s first rate rise.
The higher OCR forecasts of ANZ/Westpac and the bond market would send the average discount variable mortgage rate to 6.70 per cent and 7.15 per cent respectively.
The RBA’s latest Financial Stability Review estimated “that a 200-basis-point increase in interest rates from current levels would lower real housing prices by around 15 per cent over a two-year period”.
Therefore, Australia faces a peak-to-trough decline in real house prices of somewhere between 20 per cent and 30 per cent, based on these OCR forecasts, or between 12 per cent to 20 per cent in nominal terms assuming inflation remains high.
The more expensive markets of Sydney and Melbourne would likely experience greater declines than the national average, with the more affordable markets faring better.
More CoverageGraph shows Aussie house price ‘collapse’Aus house price crash ‘faster than expected’
Regardless, Australia is facing the biggest house price correction on record, the ultimate size of which hinges on the aggressiveness of the RBA.


Leith van Onselen is Chief Economist at the MB Fund and MB Super. Leith has previously worked at the Australian Treasury, Victorian Treasury and Goldman Sachs.


No comments:
Post a Comment